 Chinese
Numerical Experimental Study on Clogging Issues of Granular Materials in Three-dimensional Funnel
Introduction
Granular materials constitute complex systems formed by numerous discrete particles interacting with each other, exhibiting intrinsic organic connections. In nature, individual particles typically range in scale from 10^(-6)-10m, with their motion governed by Newtonian mechanics. When subjected to external forces or internal stress variations, the entire granular medium undergoes flow, demonstrating fluid-like properties and thus forming granular flow. Although granular materials appear deceptively simple (with interactions typically limited to friction, collisions, and gravity), ongoing research reveals profoundly complex dynamic behaviors. Traditional hydrodynamic and thermodynamic theories prove insufficient for comprehensively describing the flow behavior of granular media. Among these challenges stands the critical issue of characterizing the clogging phenomenon in granular materials.
In recent years, the clogging behavior of granular materials has emerged as a prominent yet challenging research focus in physics and engineering. Extensive and in-depth studies have been conducted on various aspects, including the clogging configurations of granular assemblies, density variations, and the clogging behavior along with critical characteristics during granular discharge through container orifices. In fact, clogging phenomena can occur in diverse systems, such as:Suspended particles passing through narrow channels;Electron bubbles traversing nanochannels on liquid helium surfaces;Vortex structures in type-II superconductors;Human/animal crowds passing through narrow exits;While these systems exhibit clogging behaviors fundamentally similar to granular systems, no definitive theoretical explanation exists to date. For granular systems specifically, when the orifice size becomes comparable to particle dimensions, a mechanically stable arch structure readily forms above the opening. This structure obstructs granular flow, ultimately leading to the occurrence of clogging.
In studies of various granular flows, clogging phenomena in gravity-driven funnel flows have been most extensively investigated. Numerous theoretical models have been proposed to explain clogging, while the existence of a critical orifice size for clogging in two-dimensional funnels remains controversial. To obtain sufficient clogging events in experiments, vibration or air injection is typically applied after clog formation to disrupt the arch structure, restarting flow until the next stable arch forms.
Kondic's simulations of two-dimensional conical funnels revealed that the probability distribution P(t) of clogging time *t* (from flow initiation to clogging) follows an exponential decay. Guariguata et al. constructed a horizontally oriented, water-driven granular clogging platform, finding that water flow velocity minimally affects clogging probability. Lin and Fang studied clogging in elliptical particle flows, demonstrating that the aspect ratio of major-to-minor axes significantly influences clogging probability.
Longjas et al. discovered that particle size polydispersity in funnels increases arch stability. Kunte et al. investigated clogging in multi-orifice funnel flows, observing markedly reduced clogging probability compared to single-orifice systems. Hong et al.'s oil droplet experiments suggest that clogging probability approaches infinitesimal values when friction tends toward zero.
Zuriguel et al. conducted a
series of experiments investigating clogging behavior during granular discharge
from three-dimensional cylindrical containers. They obtained thousands of
clogging events and measured the avalanche size *s* (number of particles
discharged between consecutive clogs). Experimental findings revealed:
⑴Particle
material properties and surface roughness have negligible effects on avalanche
size, whereas particle shape significantly influences *s*;
⑵The mean avalanche size follows a power-law relationship
with the inverse of R−Rc, where R
denotes orifice size and Rc the critical orifice size;
⑶The critical clogging radius varies with particle
shape, yet the critical exponent remains essentially constant;
⑷Placing obstacles above the orifice substantially
reduces clogging probability.
Saraf and Franklin performed clogging experimentsusing three-dimensional asymmetric conical funnels, discovering that—distinct from Zuriguel's conclusions—the clogging probability P(s) exhibits a power-law dependence on avalanche size *s*. During these experiments, compressed gas impulses wereapplied to disrupt arch structures near the orifice to trigger subsequent avalanches. However, the magnitude of gas-induced disturbances on experimental outcomes was not assessed.Therefore, this study employs numerical simulations to investigate first-time clogging behavior following initial orifice opening.This approach:Avoids experimental disturbances introduced to trigger subsequent avalanches;Examines effects of orifice dimensions and funnel cone angles on avalanche size.
Currently, numerical approaches for simulating granular motion are primarily categorized into: continuum methods and discrete element
methods. This study employs a multi-GPU (graphics processing unit) parallelized program based on the Discrete Element Method (DEM) and Molecular Dynamics.
The simulation utilizes the Hertz-Mindlin nonlinear contact model to compute interparticle forces. For two contacting spherical particles *i* and *j* (with radii and , position vectors and , velocities and , angular velocities and ), their interaction force consists of normal force and tangential force components.
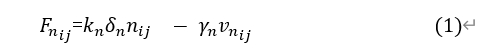
In the normal direction, the interparticle forcecomprises:Hertzian elastic force + damping force, expressed as:
In the equation, =+− (where = −,=||) represents the normal overlap between particles; =/ is the unit vector in the normal direction
between particles; = (.) (where =−) is the relative velocity in the normal direction between particles.
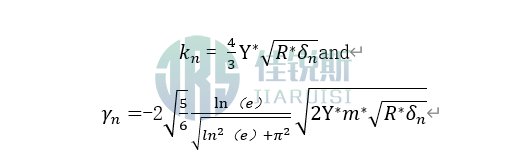
are the normal elastic coefficient and normal damping coefficient, respectively, where the equivalent elastic modulus , equivalent radius , and equivalent mass are given by the formulas
determined by; e is the coefficient of restitution for inter-particle collisions; ϑ is the Poisson's ratio. In the tangential direction, based on Mindlin theory, the tangential force between particles can be expressed as
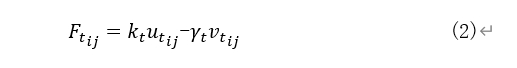
In the equation
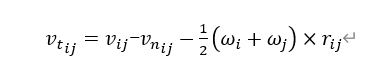
is the tangential relative velocity between particles; is the tangential displacement between particles, accumulated over contact time. Its value is zero at initial contact (i.e. |t=0), and subsequently determined by the equation
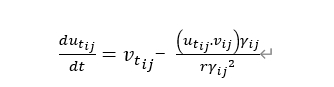
(The second term in this equation originates from the rotation of rigid bodies at the contact point, ensuring the tangential displacement vector always maintains perpendicularity to the contact plane) determines its evolution;
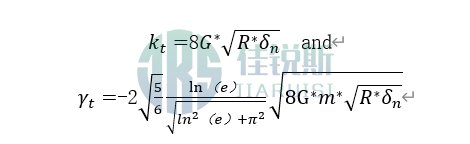
are the tangential elastic coefficient and tangential damping coefficient, respectively, where the equivalent tangential modulus is given by the formula
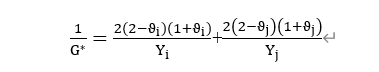
determines the
coefficient values. Additionally, the Mohr-Coulomb yield condition is enforced by truncating the magnitude of tangential displacement ,
i.e.:( ||≤|μ| , where μ is the inter-particle friction coefficient ).
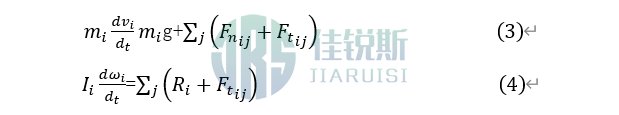
If a particle contacts a rigid boundary, the boundary is modeled as a sphere with infinite radius. Consequently, under gravity, the equation of motion for spherical particle i can be written as
where ,, , and are the mass, velocity, moment of inertia,
and angular velocity of particle i, respectively; is the vector from the particle's center to
the contact point, whose magnitude equals the particle radius.
Figure 1 shows the model used in this study. During simulation, only gravitational forces, inter-particle friction/collision forces, and particle-funnel friction/collision forces are considered, while air resistance is neglected. Gravity acts vertically downward along the funnel axis. Starting from the initial moment,5,000 particles are generated randomly on a fixed horizontal plane and fall into the funnel under gravity. After some time, particles reach a stable static pile state within the funnel. Upon removal of the baffle at the funnel outlet, particles initiate motion under gravity. The number of particles flowing out between baffle removal and the first clogging event is recorded. The entire simulation spans 1.2×10⁷ time steps (equivalent to 6 s, including 1 s for pile formation; time step details in Table 1). To ensure statistical significance, 10,000 repeated simulations are performed for each fixed funnel aperture size and cone angle, with distinct initial pile configurations generated by varying initial particle velocities. For systems with 5,000 particles, a single GPU suffices for simulation. Double-precision floating-point arithmetic is employed, with each time step requiring ≈0.1 ms of computation time. Thus, one full simulation consumes approximately 20 min. Model parameters are listed in Table 1.
Figure 1 Numerical model: (a) Three-dimensional conical funnel; (b) Three-dimensional flat-bottomed funnel (θ= )
Table 1. Simulation parameters of grains and hopper
|
参数 |
取值 |
|
Particle diameter d |
1mm |
|
Number of particles N |
5000 |
|
Particle bulk density ρ |
2500kg/m³ |
|
Young's modulus (particles & funnel) E |
70GPa |
|
Young's modulus (particles & funnel) ν |
0.25 |
|
Friction coefficient μ |
0.2 |
|
Coefficient of restitution e |
0.8 |
|
Funnel diameter D0 |
15d |
|
Orifice diameter D |
3d、3.25d、 3.5d、3.75d、 4d |
|
Funnel cone angle θ |
0°、15°、30°、45°、60°、75°、77°、80°、85° |
|
time-step Δt |
5×10⁻⁷s |
Results Analysis and Discussion
Probability Distribution of avalanche size
Based on the number of
particles flowing out between baffle removal and the first clogging event, the avalanche size for a flat-bottomed funnel (θ=) with orifice D=3d was statistically obtained from 10,000 simulations. The statistical results (probability distribution of avalanche size) are shown in Fig. 2, with the horizontal coordinate representing avalanche size (number of outflowing particles) and the vertical coordinate representing the probability
of avalanche size occurrence. From Fig. 2, it can be observed that the probability of avalanche sizes exceeding 40 is extremely small. Notably, a distinct peak emerges in the probability distribution at a avalanche size of 6.
To the left of this peak, the data appears to follow a power-law growth (insetin Fig. 3). However, due to insufficient data points, this phenomenon is not yet well understood. In the experiments of Zuriguel et al., the duration of gasimpulses, gas pressure, and funnel dimensions all influence this behavior.
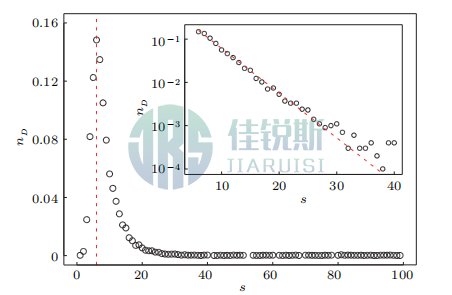
Figure 2 Probability Distribution of avalanche size (Flat-bottomed funnel orifice D=3d)
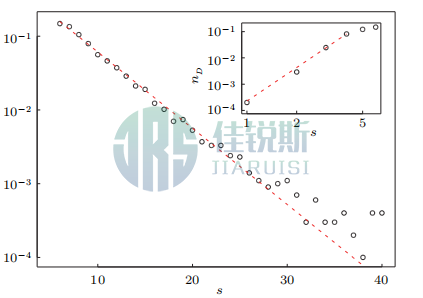
Figure 3 Probability Distribution of avalanche size (Flat-bottomed funnel orifice D=3d; Main panel: post-peak distribution (semilogarithmic scale); Inset: distribution left of peak (log-log scale))
The probability distribution to the right of the peak exhibits exponential decay (Fig.3 main panel), indicating the existence of a characteristic parameter governing the system. Accordingly, Figure 4 displays the normalized avalanche size probability distributions for all orifice sizes. These distributions essentially collapse onto a single master curve. Since the distribution left of the peak follows a power-law (non-exponential) form, this portion does not collapse well. However, the data right of the peak collapses onto curves with nearly identical slopes. The exponential decay behavior can be modeled by a simple probabilistic framework: Assuming each particle has independent escape probability *p*, the clogging probability for a particle is (1−p). Consequently, the probability of avalanche size “s”is given by:
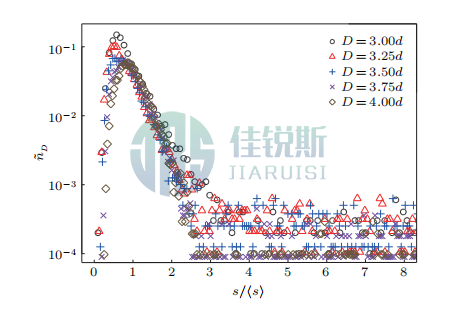
Figure 4 Probability Distribution of avalanche size
(Flat-bottomed funnel with varying orifice sizes, semilogarithmic scale)
Intriguingly, the probability distribution of avalanche size bears remarkable similarity to interparticle interaction forces, suggesting that particle clogging behavior is fundamentally linked to the static stability of granular mesoscopic structures (force chains and networks).
Critical Orifice Size
A particularly noteworthy question is: Does there exist a critical orifice size Dc in funnel flow, beyond which clogging ceases to occur?Intuitively, this is challenging to resolve. Theoretically, even for large orifice sizes, massive arch structures may still form and cause clogging—though such events require sufficiently long observation times to materialize. To address this, Figure 5 presents the relationship between the mean clogging size and orifice size D in flat-bottomed funnels.The data reveal that diverges as D increases. To demonstrate this as a phase transition (clogging occurs below Dc; no clogging above Dc), one
must verify whether follows power-law scaling near the critical orifice. Computational challenges arise due to uncertainty in the exact Dc value. Nevertheless, we fit the data using the power-law function:
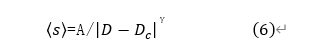
Where A and γ are constants. The fitting results are presented in Fig. 5, yielding A=123.8, Dc= 4.75, and γ=1.5. This fitting indicates a critical orifice size of approximately 4.75d in the current system.
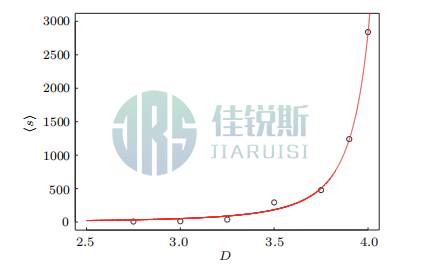
Figure 5 Mean avalanche size versus orifice size D in flat-bottomed funnels
Effect of Funnel Cone Angle
Further,the influence of funnel cone angle θ on clogging behavior was investigated with fixed funnel diameter (D0=15d) and orifice size (D=3d). The study reveals that when θ is (Fig.6), the avalanche size distribution shows little difference from that of a flat-bottom funnel (θ =).However, when θ exceeds , the distribution exhibits two peaks: one concentrated in the s < 3 region and another peak around s= 9. This latter peak is slightly larger than the peak (s=6) observed in flat-bottom funnels.The existence of the first peak is readily understandable: the conical funnel opening facilitates the formation of relatively stable arch structures near the orifice during accumulation. This causes the system to directly transition into a clogged state without undergoing flow. Regarding the probability distribution for s>10, increasing the funnel cone angle elevates the frequency of events where s>10.
Similarly, in funnel flow, is there a critical funnel angle θ such that when the cone angle exceeds this critical value, clogging will not occur? Considering that the avalanche size becomes very large when the funnel angle approaches the critical value, we simulated a funnel flow system with a larger granular assembly (with N=40,000 particles). The results reveal that when θ>, the system clogging probability decays exponentially (avalanche size exceeds 40,000). Evidently, when θ=(i.e., when the funnel becomes a straight pipe), clogging should not occur. Our numerical results indicate that this critical value in three-dimensional funnels is approximately .
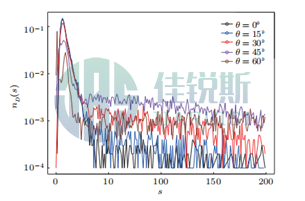
Fig.6. Probability distribution of collapse scale with various hopper angle (hopper outlet D=3d)
Conclusions
Utilizing our self-developed GPU program, we simulated granular clogging phenomena during particle discharge through circular orifices by establishing a three-dimensional funnel flow model. This investigation examined:Relationship between avalanche size and orifice dimensions;Existence of critical orifice size;Influence of funnel cone angle on clogging probability. Key conclusions are as follows: ⑴For fixed orifice size, the avalanche size probability distribution satisfies an exponential decay distribution beyond the peak value; ⑵Through normalization, distributions beyond the peak for all orifice sizes essentially collapse onto a single master curve; ⑶The observed exponentially decaying probability distribution beyond the peak can be accounted for by a simple probabilistic model; ⑷Fitting the relationship between mean avalanche size and orifice size reveals a critical orifice dimension Rc: clogging ceases to occur when orifice size exceeds Rc; ⑸When funnel cone angle θ≤,*θ* exerts negligible influence on⟩.However, a critical cone angle *θ* exists beyond which clogging becomes thermodynamically improbable.